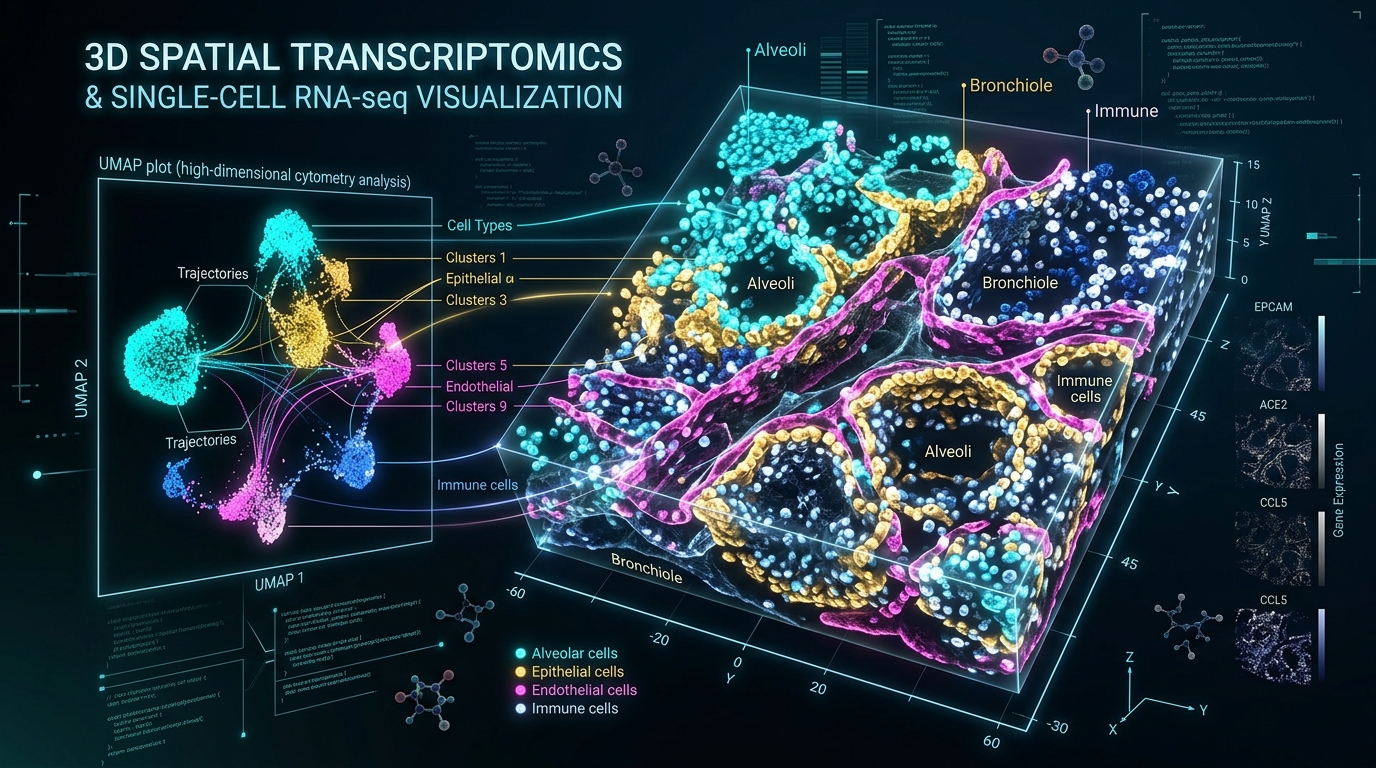
 Single-cell, Spatial & Cytometry
Overview
Subpopulation detection in single-cell data. Clusters require biological annotation and sensitivity checks.
Information checked against an official source; not a hands-on test. Source · Last reviewed: 15/09/2026, 19:45:19
By Pe’er Lab / PhenoGraph contributors →
Subpopulation detection in single-cell data. Clusters require biological annotation and sensitivity checks.
Report incorrect information or a broken link →
Subpopulation detection in single-cell data. Clusters require biological annotation and sensitivity checks.
Information checked against an official source; not a hands-on test. Source · Last reviewed: 15/09/2026, 19:45:19
Use this citation format when referencing PhenoGraph in scientific publications and benchmark papers.
@software{phenograph_2026,
  title = {{PhenoGraph}},
  author = {{Pe’er Lab / PhenoGraph contributors}},
  year = {2026},
  url = {https://github.com/dpeerlab/PhenoGraph},
  note = {Indexed on aibioatlas - AI for Biology and Drug Discovery}
}Live scientific citations streamed from Europe PMC and PubMed for PhenoGraph.
Missing values mean the catalog has no recorded information. They do not mean a feature is absent.
No software–hardware integration has been verified for this entry yet. Explore documented research workflows.
No licensed product photograph recorded for PhenoGraph yet. Visit the official resource below for manufacturer imagery.
Similar entries from the same category.
Python Library · Open Source
Unified data framework and storage format for spatial multi-omics
scverse Consortium
Free Open SourceSoftware Pipeline · Proprietary Freeware
The industry-standard analysis pipeline for Chromium single-cell sequencing
10x Genomics
Free to download for 10x Genomics dataNo verified news linked to this product yet.
Browse all AI news →Public research software
Prices reflect the source at its last check. Confirm current pricing and regional availability on the official site.
Feedback from researchers and computational biologists evaluating PhenoGraph.